


Introduction
Most of polymers usually contain high levels of unsaturation in the polymer backbone. The unsaturation of polymer means what includes carbon-carbon double bond (-C=C-) in its backbone. Such polymers are natural rubber (NR), styrene butadiene rubber (SBR), and polybutadiene rubber (BR). “R” expressed in the ASTM designations does not mean “rubber” but does refer to “the presence of unsaturation” in the polymer backbone. Most of these polymers are susceptible to degradation when exposed to ultra-violet (UV) radiation, heat, water, ozone, and oxygen. The lifetime of a material is determined by UV radiation (photochemical degradation), thermal oxidation, ozone oxidation, or a combination of these factors.1-6
The reaction of NR with oxygen in heat has been the subject of considerable research and a number of reviews of the field are available. The thermal oxidation will either cause hardening or softening, depending on the microstructure of the diene elastomer. BR usually undergoes oxidative hardening whereas NR is known as oxidative softening when exposed to heat and oxygen. NR is known to undergo a competitive reaction of chain scission and crosslinking during the thermal oxidation. Although the general mechanism of thermal oxidation is well understood, the actual chain scission and crosslinking steps are often unknown. The reaction is known to be a complex through a free radical chain reaction.
NR has four kinds of microstructures in its molecular chain which are cis-1,4-, trans-1,4-, 1,2-, and 3,4-polyisoprene. The main ingredient of NR is cis-1,4-polyisoprene. There are numerous publications on the degradation processes of both vulcanized and unvulcanized NR. Degradation products of NR that have been identified are hydroperoxides, peroxides, alcohols, aldehydes, ketones, epoxides, ethers, and carboxylic acids.7-10
Generally, rubber vulcanizates possess various types of materials such as polymers, carbon blacks, process oils, anti-oxidants, accelerators, crosslinking agents, and activators. When rubber vulcanizates are exposed to oxygen, complex chemical reactions can occur. However, it is not easy to detect characteristic oxidation reactions of polymer itself using lights such as fourier transform infrared (FT-IR) or Raman spectroscopy because rubber vulcanizates include an excellent light absorbing material like carbon black. Therefore, investigation of oxidation reactions by environmental conditions is only important when the rubber is transparent, as with raw rubber or pure gum peroxide vulcanizates.11
In this study, the characterization of the thermal oxidation on a transparent thin film of raw NR was investigated in a dark chamber at 80°C under low humidity conditions through Image and FT-IR analysis. The analytical techniques were used with FT-IR spectroscopy (Bruker, IFS 85) and Image analyzer (Olympus, SZX16).
Experimental
SMR 20 as natural rubber was used. This grade with total nitrogen content 0.6% (w/w rubber) from protein was made from field coagulum in Malaysia. Table 1 shows standard malaysian rubber specifications of SMR 20.12
NR in raw was cut into 1 mm3 in size and extracted with acetone for 4 h to remove residual emulsifying agents or soluble organic substances which interfere with spectra of NR. The specimen was dried at 25°C for 1 day. 1 g of dried sample was dissolved in a sealed beaker including 100 mL of toluene at room temperature for 7 days. The concentration of the solution was adjusted to contain 1% NR solution (w/v). The sample for measurement of the FT-IR spectroscopy and Image analyzer was prepared as follows. A transparent thin film of raw NR was made on a transparent KBr window with dimension of 20 × 20 × 5 mm (width × length × thickness) by coating from 1% NR solution. 1~2 drops of the solution using a glass capillary were dropped and coated thinly on a KBr window. The film thickness must be adjusted to give an absorbance of about 0.9 at 2924 cm−1. Sample coated on a KBr window was maintained to evaporate toluene in a dark at room temperature for 7 days.
The thermal oxidation test was operated in the dark at 80°C oven for 753 h to exclude completely light oxidation. The thermal oxidation was conducted on a transparent thin film of raw NR coated on a KBr window.
The images of before and after thermal oxidation were observed on thin film using Image analyzer (Olympus, SZX16). The spectral changes of thin film of raw NR were measured in transmission mode at different thermal exposure times using FT-IR spectroscopy (Bruker, IFS 85). FT-IR spectra were scanned from 400 to 4,000 cm−1 with a resolution 4 cm−1. The average of 32 scans for sample was taken for the measurement.
Results and Discussion
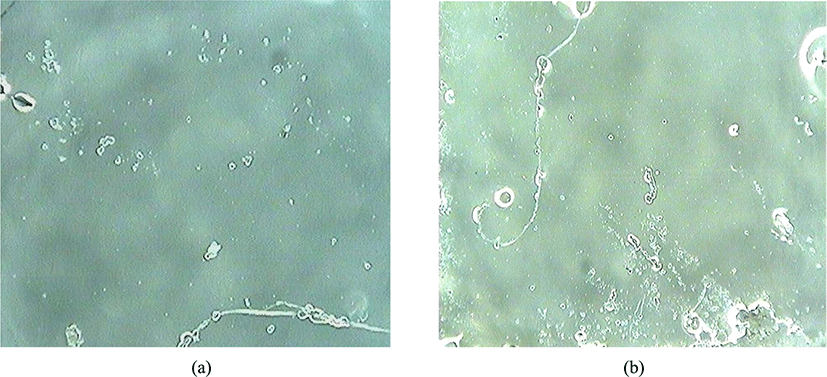
Figure 1 shows images for a transparent raw NR thin film coated on a KBr window (a) before thermal exposure and (b) after thermal exposure of 753 h. To exclude completely the moisture or light oxidation, the thermal oxidation was performed in the dark at 80°C oven under low moisture conditions. Figure 1(a) shows that the image for thin film of raw NR before thermal oxidation was neat and clean. When my hand touches the surface of thin film, it can feel like a flexible soft rubber. Figure 1(b) indicates that the one for thin film of raw NR after thermal oxidation shows no difference in appearance as compared to the one before thermal oxidation. However, when I press the surface of thin film with my fingernail, it can be felt like hard glass. This hardening seems to appear evenly at all sites. It is considered that hardening can be produced by changes of the chemical structures of NR as a result of the thermal oxidation. In fact, this hardening results in a crosslinking between polymer chains. Therefore, the surface image of this thin film after thermal exposure shows no cracks unlike the UV-oxidation13 and the ozone oxidation.14
FT-IR absorption spectra for a transparent thin film of raw NR with the thermal exposure time ranging from 4000 to 400 cm−1 in the dark at 80°C are illustrated in Figure 2. It is observed that oxidation reactions take place because there is the increment and reduction of intensity at some peaks according to the thermal exposure time.
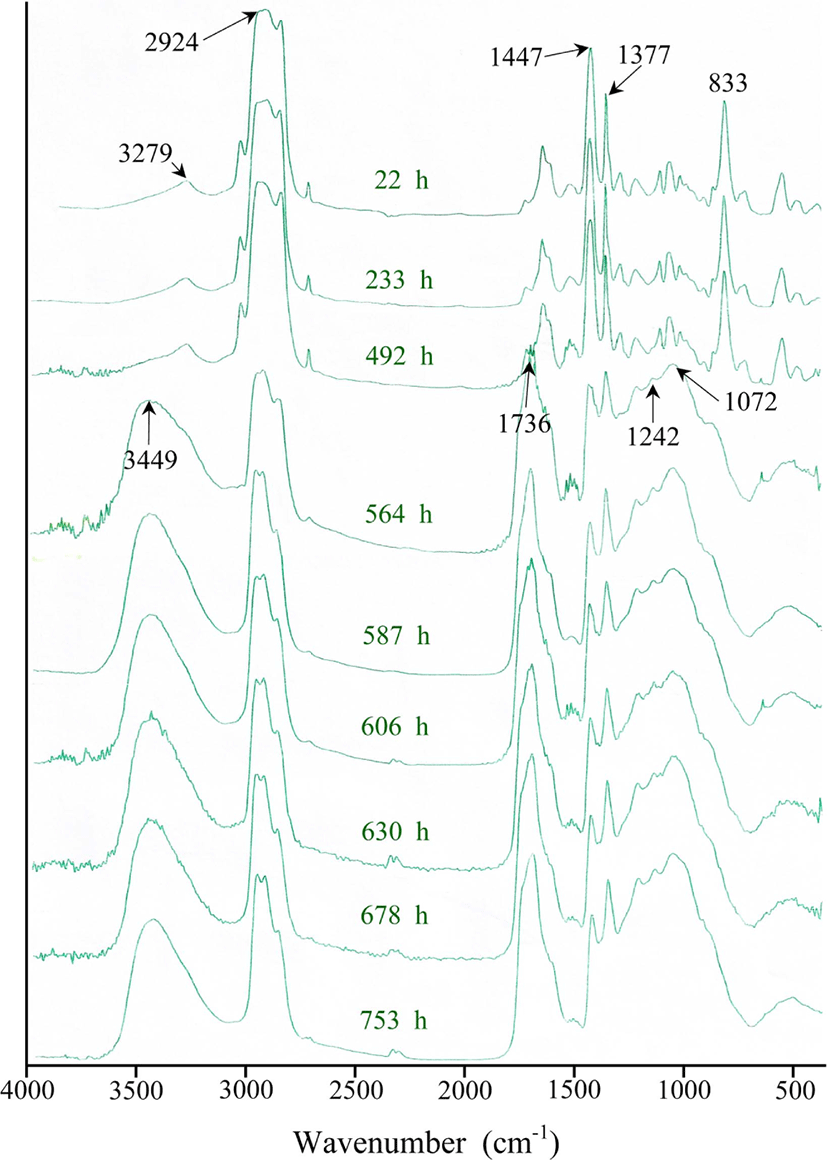
As shown in Figure 2, in the region ranging from 2500 to 4000 cm−1, the FT-IR spectrum of NR reveals there is a broad peak near 3449 cm−1, showing sudden increment at 564 h of the thermal exposure. This broad peak means the formation of a hydroxyl group (-OH) as a result of the thermal oxidation like the UV oxidation.13 In ozone oxidation, however, the spectra show there is no broad peak.12 A broad peak near 3279 cm−1 before thermal exposure may be assigned to a N-H bond of an amide group (-CONH-) from small amount of proteins contained in NR.15
In the region ranging from 500 to 2000 cm−1, the spectral patterns indicate that the intensity of broad absorption peaks near 1736 cm−1 increases very fast at 564 h of the thermal exposure. This broad peak may be assigned to carbonyl group (-C=O) from a ketone (R2C=O) and an aldehyde (RCHO). In the literature, it is well known that the peaks of carbonyl groups at 1736 cm−1 and 1715 cm−1 are attributed to aldehyde and ketone, respectively.16 Thus, it was inferred that carbonyl group of an aldehyde or a ketone was produced as a result of the thermal oxidation.
As also shown in Figure 2, although the FT-IR spectrum of NR shows there is a very weak broad peak near 1000-1250 cm−1 region before thermal exposure, the spectra reveal that the intensity of overlapped peaks at 1242 and 1072 cm−1 in this region increases sharply at 564 h of the thermal exposure. The overlapped broad peaks mean that a variety of carbon-oxygen single bonds (-C-O) can be formed and be assigned to carbon-oxygen single bond from primary or secondary alcohols, ethers, peroxides, esters, epoxides, carboxylic acids, lactones, and anhydrides.1 In details, the peak at 1242 cm−1 could be allocated to epoxides, esters, carboxylic acids, lactones, and anhydrides. One at 1072 cm−1 could be allotted to primary or secondary alcohols, ethers, peroxides, and cyclic peroxides. In case of the UV oxidation of NR, on the other hand, the peak at 1084 cm−1 in this region increases slowly and continuously with the UV irradiation time and results in the formation of primary or secondary alcohol.13 In case of the ozone oxidation of NR, the intensity of broad peaks in this region showed no change.14
The spectral patterns show that the intensity of peaks at both 1477 cm−1 and 1377 cm−1 decreases with the thermal exposure time. The peaks of both 1477 cm−1 and 1377 cm−1 are assigned to a methylene (-CH2-) and a methyl group (-CH3) in NR, respectively. It means that the chemical structures of two groups are changed by the thermal oxidation.
The spectral patterns also show that the intensity of peaks at 833 cm−1 decreases sharply at 564 h. This peak is assigned to cis-methine group (cis-CCH3=CH-) including double bond. It was considered that the formation of carbonyl compounds was directly related to the decrement of the double bonds of cis-1,4-polyisoprene. It will be discussed in details later. Table 2 represents characteristic FT-IR peaks for the unoxidized and oxidized natural rubber.
To express quantitatively the increment and decrement of intensity at each absorption peak, Table 3 represents the peak height in each FT-IR absorption according to thermal exposure time based on Figure 2. Numbers are obtained from their peak heights based on baseline. Each peak height means its absorbance which is related to its quantity (or concentration) according to Beer-Lambert law. As described in Table 3, the peak height at 2924 cm−1 representing carbon-hydrogen stretching vibration shows the maximum at an initial thermal exposure. Table 4 represents the relative abundance calculated from the absorption peak ratio of Ax (X=3449, 1736, 1447, 1377, 1072, 1242, and 833 cm−1) to A2924 based on the maximum peak. Figure 3 indicates the change curves of the increment and reduction in each absorption frequency with the thermal exposure time based on Table 4.
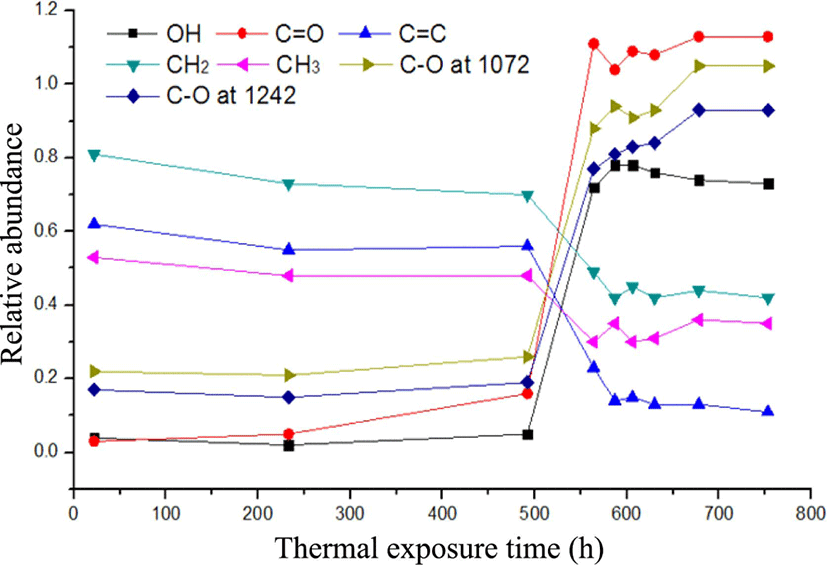
During the thermal exposure time, the change curves show that the relative abundance of carbonyl group (-C=O) increases quickly from 0.16 to 1.11 between 492 h and 564 h. After the thermal exposure of 564 h, the relative abundance of carbonyl group did not increase, maintaining constantly. The relative abundance of cis-methine group also decreases greatly from 0.56 to 0.23 between 492 h and 564 h. After that the peak does not seem to decrease. The formation of carbonyl compounds seemed to have to do with the decrement of the double bonds of cis-1,4-polyisoprene. Carbonyl groups were mainly from aldehydes (-CHO) and ketones (-C=O) by chain scissions in an initial state, not from esters (-COOR) or carboxylic acids (-COOH) by further oxidation process later. Thus, the increment of the relative abundance of carbonyl group could be closely related to chain scission of carbon-carbon double bond, resulting in chain softening as discussed in UV-oxidation.13
The relative abundance of hydroxyl group (-OH) increases fast from 0.05 to 0.78 between 492 h and 587 h and after that decreases slightly. The relative abundance of a methyl group (-CH3) and a methylene group (-CH2-) decreases from 0.48 to 0.30 and from 0.70 to 0.49 between 492 h and 564 h, respectively and after that maintains constantly. The increase of the relative abundance of hydroxyl group had a lot to do with decrement of that of both a methylene and a methyl group. The decrease of the relative abundance of these two groups between 492 h and 564 h can result in the formation of allyl radicals from hydrogen abstraction of methyl or methylene groups. In this process, an alcohol can be formed by reacting an allyl radical with an oxygen molecule. The decrement of the relative abundance of alcohol group after 606 h might be considered as a result of oxidative crosslinking of an allyl radical with an alkoxy radical from an alcohol. It will be explained again in mechanism of thermal oxidation. The relative abundance of carbon-oxygen single bond (-C-O) at 1072 cm−1 and 1242 cm−1 increases fast between 492 h and 564 h and after that increases slightly. It was considered that carbon-oxygen single bond (-C-O) at 1072 cm−1 was from ethers, peroxides, cyclic peroxides, and alcohols and that at 1242 cm−1 was from epoxides. These materials such as ethers, peroxides, and cyclic peroxides were produced by the combination of radicals. An epoxide was formed by a oxidative crosslinking.
The increment of the relative abundance of carbon-oxygen bond at 1072 cm−1 after 606 h was closely related to reduction of the relative abundance of a hydroxyl group. It was inferred that a hydroxyl group formed firstly could be chemically bound in NR to produce an ether (-C-O-C) as a result of a oxidative crosslinking among polymer chains. An increment of the relative abundance of C-O single bonds at 1072 cm−1 could also result in formation of peroxide or cyclic peroxides. As a result, it brought chain hardening or embrittlement as observed in image analysis after the thermal oxidation.
From these results, The appearance of carbonyl groups was directly related to the disappearance of cis-methine groups and the formation of hydroxyl groups had also a lot to do with the decrement of methyl or methylene groups. The formation of carbonyl compounds such as aldehydes and ketones by chain scissions and alcohols by allylic radical seem to happen competitively each other in an initial thermal oxidation. However, crosslinking reactions seem to dominate later as described in image analysis.
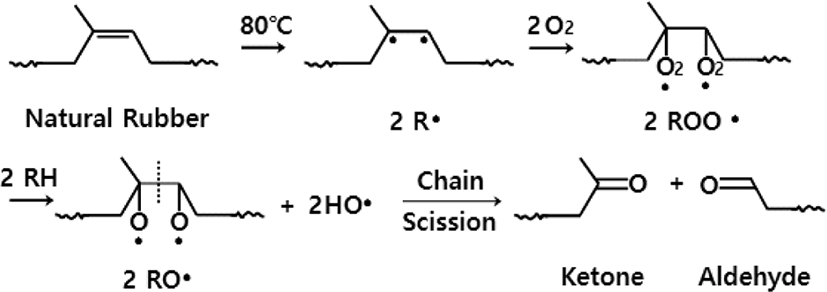
As before mentioned, what change curves increase or decrease at each absorption frequency in the thermal oxidation must be considered as a complex process. The mechanism for the thermal oxidation of NR has been known as complex for many years and reviews of this field are available.17-22 In this research, the mechanism for the formation of carbonyl groups, hydroxyl groups, and two carbon-oxygen single bonds from NR by the thermal oxidation can be explained briefly in two steps as follows. This mechanism was well known through many studies for a long time. The initial step of the thermal oxidation consists of the formation of two different kinds of free radicals on NR.8 As seen in Figure 4, two free radicals (2R·) are formed by the homolytic cleavage from a double bond.
As represented in Figure 5, allyl radicals (R·) could also be formed by abstraction of an allylic hydrogen in methyl or methylene groups. Allyl radicals show 6 different kinds of structures. They have three resonance structures in pairs [I, II, III]. Two kinds of radicals seem to be produced simultaneously in an initial step. The reactions of these radicals with oxygen molecules seem to proceed competitively with each other. In UV-oxidation, however, the reactions of two free radicals produced from the double bond with oxygen seem to proceed predominantly.13
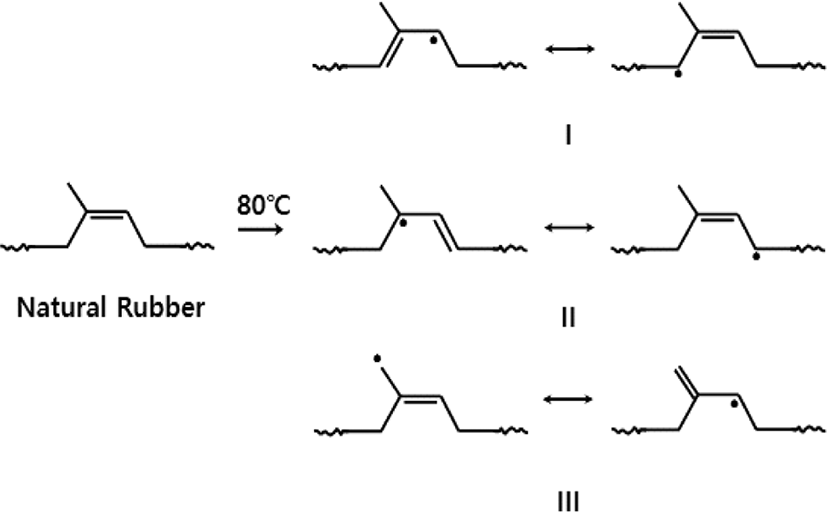
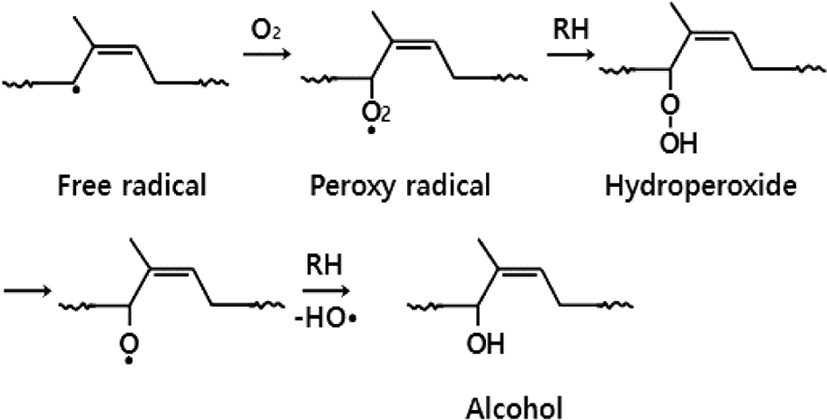
One is that two free radicals (2R·) formed from a double bond bind with two oxygen molecules, finally producing an aldehyde and a ketone through chain scission like the UV-oxidation. The other is that an allyl radical binds with an oxygen molecule, finally producing an α,β-unsaturated alcohol as depicted in Figure 6. Other α,β-unsaturated alcohols could also be formed from other resonance structures [I, II, III]. Some part of α,β-unsaturated alcohol could be converted to alkoxy radicals (RO·) to form ethers later.
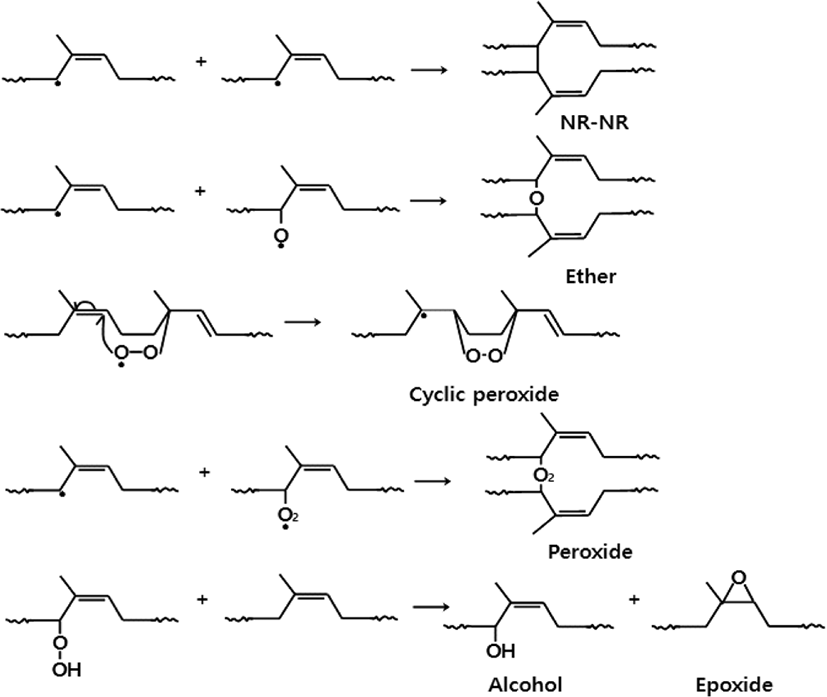
In a later step, it was thought that oxidative crosslinking dominates through the combination of free radicals such as an allyl radical (R·), an alkoxy radical (RO·), and a peroxy radical (-ROO·), producing a carbon-carbon linkage (NR-NR), an ether (C-O-C), a cyclic peroxide, and a peroxide (ROOR) as can be seen in Figure 7.4,7 It was also considered that an epoxide could be produced through oxidative reactions of a hydroperoxide (-ROOH) with double bond.23
Conclusions
The characterization of the thermal oxidation of raw NR thin film was investigated using Image analyzer and FT-IR spectroscopy. The thermal oxidation was performed on thin film of raw NR coated on a KBr window in a dark chamber at 80°C under low humidity conditions to exclude moisture or light oxidation.
After thermal oxidation, the image of thin film showed no change in appearance. When the surface of raw NR thin film was touched, however, it was felt hardening like glass, meaning oxidative crosslinking.
FT-IR absorption spectra of NR thin film with the thermal exposure time showed the increment of peak intensity at 3449, 1736, 1242, and 1072 cm−1 and the decrease of peak intensity at 1447, 1377, and 833 cm−1. Peaks at 3449 cm−1 were assigned to hydroxyl groups (-OH) from alcohols. Peaks at 1736 cm−1 were allotted to aldehyde (RCHO) and ketone (RCOR). Peaks at 1242 and 1072 cm−1 were assigned to carbon-oxygen single bonds from epoxides and ethers (ROR), alcohols (ROH), peroxides (ROOR), and cyclic peroxides, respectively. Peaks at 1447, 1377, and 833 cm−1 were assigned to methylene, methyl, and cis-methine groups, respectively. The relative abundance of carbonyl compounds, alcohols, and two carbon-oxygen single bonds increases and that of methylene, methyl, and cis-methine groups decreases with the thermal exposure time.
In an initial step, the thermal oxidation of NR was initiated randomly simultaneously at both carbon-carbon double bond and allyl position of methyl or methylene group. Carbonyl compounds such as aldehydes and ketones were produced by chain scissions. Alcohols were formed from allyl radicals through hydrogen abstraction of methylene or methyl groups. Two reactions seemed to proceed competitively with each other. In a later step, oxidative crosslinking seemed to dominate through the combination of free radicals such as an allyl radical (CH=CH-CH2·), an alkoxy radical (RO·), and a peroxy radical (ROO·) and the reaction of a hydroperoxide (-ROOH) with double bond. Materials such as ethers, peroxides, cyclic peroxides, and epoxides seemed to be produced by oxidative crosslinkings. Thus, one possible two-step mechanism for the thermal oxidation was suggested.