Introduction
It is well-known that addition of fillers to rubber reinforces the mechanical properties of the rubber/filler system drastically in comparison with neat rubber. The rubber/filler system has been widely used in industrial applications, such as car tires. From the viewpoint of environmental problems, the reduction of rolling resistance in tire is required to reduce fuel consumption effectively. However it is difficult to attain the reduction of rolling resistance as well as good wet grip, which is especially important in terms of safety. To overcome this difficulty, the control of aggregate structure of filler has been desired. Because the dispersion of filler in the rubber/filler system affects the mechanical properties.
Transmission electron microscope (TEM)1-3has been widely used for the observation of the structure of the fillers in rubbers. Recently, TEM-CT method enables us to observe 3D structure of the filler dispersion.4-6 However, we cannot observe the structure with TEM under shear flow insitu and the time changes in the structure.
In contrast to TEM, the scattering techniques enable us to analysis the filler dispersion quantitatively and to observe in situ under various environments.7-15 In addition, the filler dispersion can be observed in the wide scale by combined X-ray scattering and neutron scattering method. Koga et al. investigated the dispersion of CB in SBR using combined ultra small-angle neutron scattering, ultra small-angle X-ray scattering (USAXS) and small-angle X-ray scattering (SAXS).13,14 They successfully combined data and found that the filler consists of the hierarchical structure. The aggregates comprise approximately nine fused primary CB particles and agglomerate formed by the aggregates with mass fractal dimension. Moreover, they analyzed the size of aggregate and agglomerate, the surface dimension of the primary CB particles and the mass-fractal dimension quantitatively by using the theoretical scattering profile expressed by Unified Guinier/Power-law equations.
We can observe insitu under shear flow by using Synchrotron X-ray scattering method. Insitu measurements are expected to clarify the dispersion processes of fillers under deformation. Shinohara et al. observed the change of the silica’s dispersion under elongation by using insitu ultra small angle X-ray scattering.15 The results show that the distance of silica particle increase as strain increase but the distance of silica particle which connect with the rubber doesn’t change.
In this study, we focus on the process of dispersion during shear flow. In order to observe the change in the dispersion of filler, we did insitu USAXS measurement by using synchrotron X-ray source under shear flow.
Experiment
The rubber and the fillers used in this study are Liquid polyisoprene (PI) from Kuraray Co. Ltd. (LIR-50, number-averaged molecular weight Mw = 54,000) and carbon black (CB) (N326, Specific surface areas measured using nitrogen adsorption method 81 m2/g, Dibuthyl phthalate adsorption for the CB filler 75 cm3/100 g, arithmetic average particle diameter 28 nm), respectively. The volume fraction of CB is 10%. The PI and CB were dissolved into a solution with toluene in which total weight fraction of the rubber/filler are 10%. The mixture was obtained by evaporating the solvent.
We measured the scattering intensity under shear flow by using time-resolved USAXS. Time-resolved USAXS measurement was carried out at BL19B2 and BL20XU in SPring-8, Japan. At BL19B2, the X-ray energy and the sample-to-detector distance were respectively 24 keV and 40 m and the scattering vector q range is, thus, from 0.008 nm−1 to 0.2 nm−1, where q is the magnitude of the scattering vector defined by q = (4π/λ)sin(θ/2) with λ and θ being the wavelength of the incident beam and the scattering angle in the medium, respectively. At BL20XU, the X-ray energy and the sample-to-detector distance were respectively 23 keV and 160 m. With this USAXS configuration of BL20XU, the q range of 0.003 to 0.02 nm−1 is partially overlapped with those of USAXS results of BL19B2, therefore we can widen observable q-range by combining the USAXS measurement of BL19B2 with that of BL20XU. All measured intensities were averaged in the direction of parallel and perpendicular to the shear flow after corrections for the sample transmittance, and the scattering from the empty cell used in this experiment.
To impose shear flow, we used a heating shear stage for SAXS, CSS450WX (LINKAM SCIENTIFIC INSTRUMENTS). Measurement temperature is 140ºC and shear rate is 10 s-1. The X-ray was introduced along the direction perpendicular to the plates or the velocity gradient direction Oy. The detecting plane was set to the Oxz plane, where Ox axis is the shearing direction and Oz axis is the vorticity or neutral direction.
Results and Discussion
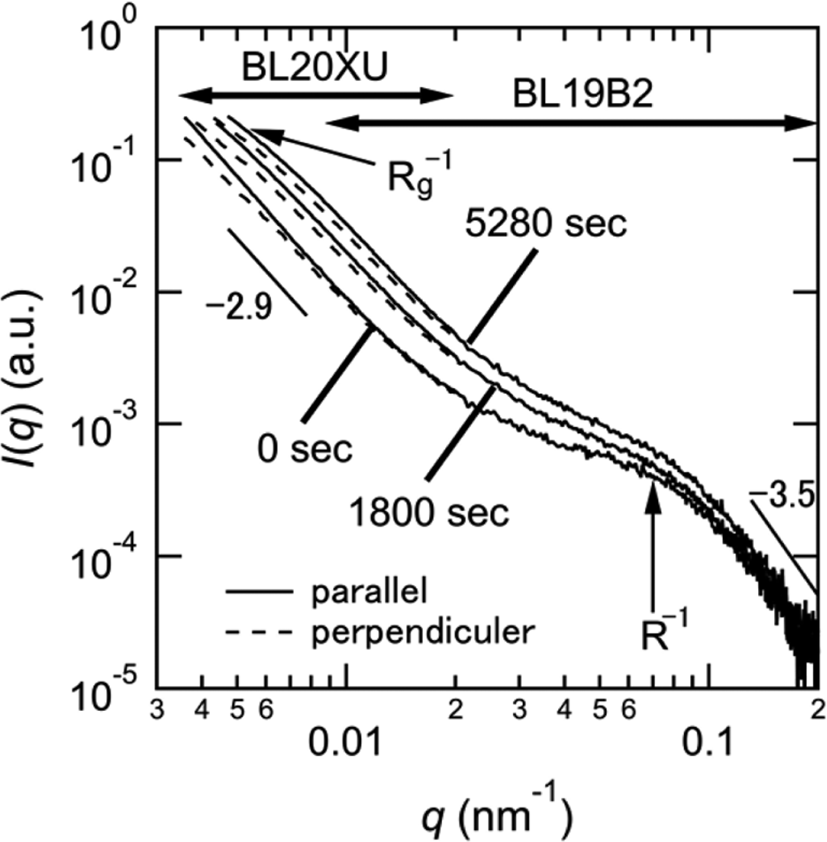
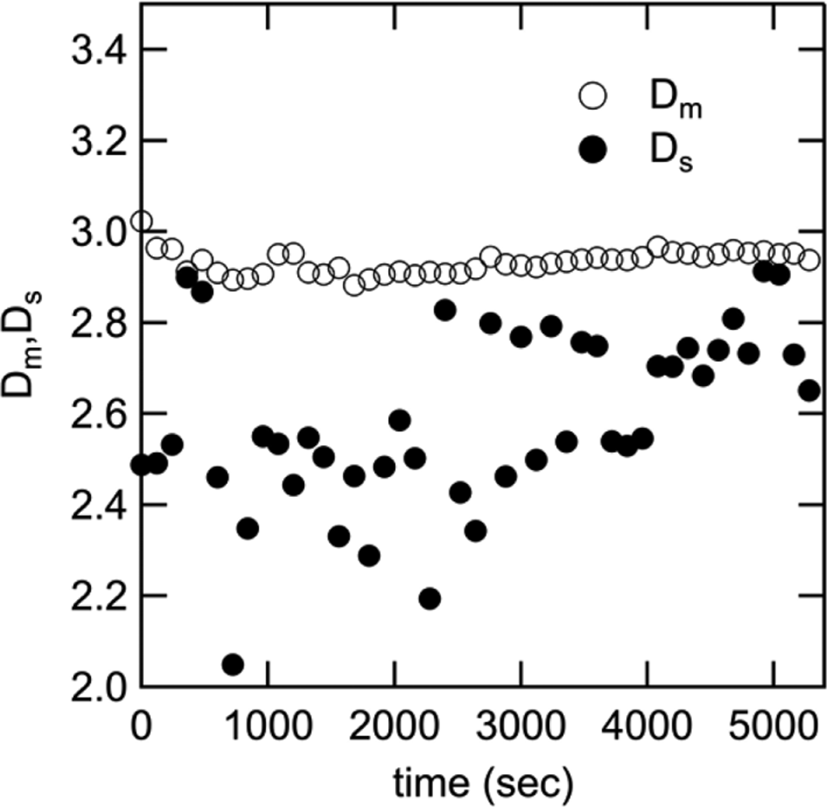
Figure 1 shows the scattering intensity obtained from the BL19B2 and BL20XU data in the direction of parallel and perpendicular to the shear flow after the onset of shearing. Solid lines are the scattering intensity parallel to the shear flow and broken lines are the scattering intensity perpendicular to the shear flow. From the figure, we can see two power-law behaviors and the one shoulder immediately after the start of shearing (0 sec), indicating that the carbon black has already formed the hierarchical structure immediately, as suggested by the earlier works. At the high q region (0.13 <q <0.2 nm−1), the slope is 3.5, suggesting that surface fractal dimension Ds of the primary particles is 2.5. Around q = 0.07 nm−1, the shoulder appears. This shoulder is originated from the aggregate of primary particles. At the low q region (0.004 < q <0.01 nm−1), the slope is 2.9, suggesting that aggregates make network structure with mass fractal dimension Dm = 2.9.

The scattering intensity perpendicular to the shear flow is larger than that parallel to the shear flow in the q range from 0.004 to 0.01 nm−1. At 0 sec, the size of agglomerate, which is upper limit of the mass fractal structure consisting of the aggregates is macroscopic scale and beyond over this q-range. The anisotropy of the scattering pattern indicates that the agglomerate elongates by shear flow.
At 1800 sec and 5280 sec after the shear applied, the scattering intensity increases with time, indicating that the number of agglomerate and aggregate increases with time. We can still observe the power-law behavior of 2.9 at q < 0.01 nm-1 but the deviation from the power-law becomes more significant around q = 0.005 nm−1 with time. This tendency suggests that the mass fractal dimension of aggregate doesn’t change and the size of agglomerate Rg is detected in this q-range at 1800 sec and 5280 sec because the agglomerate was broken and becomes smaller by shear flow. In addition, the scattering patterns is anisotropic around 0.005 nm−1 at 1800 sec and 5280 sec, indicating the agglomerate elongates by shear flow. On the other hand, the shoulder around 0.07 nm−1 doesn’t change with time and is isotropic, suggesting that the size and shape of aggregate is not affected by shear flow. The surface fractal of the primary particle also maintains 2.5.
In order to analyze the hierarchical structure quantitatively, we applied Unified Guinier/Power-law approach to the scattering profiles.16-18
This equation can explain the hierarchical structure of the filler in the rubber/filler systems quantitatively and the scattering intensity I(q) is expressed by
where Rg, R, Dm, Ds are, respectively, the radius of gyration of the agglomerate, the radius of gyration of the aggregate, the mass-fractal dimension of the aggregate, and the surface fractal dimension of the primary particles. G, A, B, C are expressed by
and P=6−Ds, where ρ, NA, VA, NB, VB are, respectively, the electron density difference between the CB and the PI, the number of agglomerate, the volume of an agglomerate, the number of aggregate, the volume of a silica particle. The value of parameters G, Rg, A, Dm, R, B, C, Ds can be obtained by applying this equation to the scattering profiles.
Figure 2 shows the change of the size of agglomerate in the direction of parallel to the shear flow (Rg,v) and perpendicular to the shear flow (Rg,h), and the size of aggregate with time. At 0 sec, Rg,v is larger than Rg,h, suggesting that agglomerate elongation by shear flow in the direction of shear flow as mentioned above. As time increases, Rg,h and Rg,v decrease monotonically, indicating the elongated agglomerate is peeled from surface. On the other hand, R doesn’t change very much. The aggregate isn’t affected by shear flow.

As the number of aggregate of an agglomerate is N0, NA and VA are given by
Then G/B is expressed by
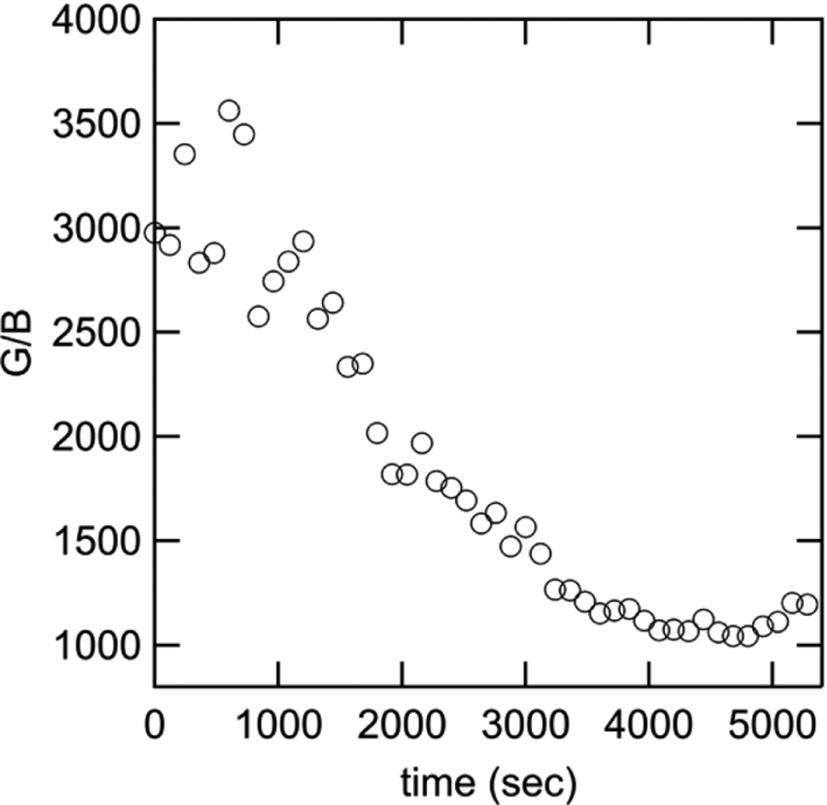
Therefore, G/B means the number of aggregate an agglomerate. Figure 3 shows G/B as a function of time. At 0 sec, G/B equals 3000, suggesting that the aggregate exists 3000 an agglomerate. Under shear flow, G/B decreases as time increases. This is because agglomerate is broken by shear flow. The density of aggregate in an agglomerate doesn’t change because mass fractal dimension keeps 2.9 as shown in Figure 4, indicating that agglomerate doesn’t shrink but is peeled by shear flow. As shown in Figure 4, Ds almost maintains 2.6, suggesting that surface fractal doesn’t change by shear flow.
G/Rg6 is proportional to NA and B/R6 is proportional to NB because and VB∝R6. Both G/Rg6 and B/R6 increase monotonically as time increase. This is because the number of agglomerate increase by the destruction of large agglomerate which can’t be detected in q region of this experiment and the aggregate increase by the destruction of agglomerate simultaneously. The aggregate may agglomerate again, but the increasing by distraction is dominant, so B/R6 increase as time increase.
Conclusions
We have investigated the dispersion process of CB in PI under shear flow. In the early stage of the application of shear flow, the number of agglomerate increases and the size of agglomerate become small with time. In this region, the dispersion processes of the grain of CB with the size being above 10 μm into small agglomerate becomes dominant. During this dispersion, shear flow did not affect the size and the surface fractal of the aggregation. In addition, the number of aggregate in an agglomerate decrease with time and the mass fractal dimension of aggregate doesn’t change simultaneously. This means the density of aggregate in an agglomerate doesn’t change even if the agglomerate is broken, indicating the aggregates peel off the surface of the agglomerate.


