Introduction
The development of abrasion and rolling resistant rubber compounds, notably silica-filled rubbers for tire industries has be-come an important issue in industries and academia because the life of the tires mainly depends on their resistance to abrasions and wet gripping. The direct evaluation of wear performance of tires is not only a long-term testing process under complex conditions but also found to be an expensive one.
In this regard, a systematic study of rubber composites was firstly carried out by a group of Natural Rubber Producer’s Re-search Association (NRPRA) during the 1950s in the UK and later on Rivlin and Tomas have adapted Griffith’s fracture ap-proach for the tear behavior of the rubber compounds. Since then, systematic studies about failure behavior of fatigue fracture and frictional wear of rubber composites have been carried out by various workers including Rivlin, Schallamach, Thomas, Gent, and Lake. Until now, the fatigue failure and frictional wear in rubber compounds have been explained considering the mechanisms, which are based on intrinsic abrasion,1,2 abrasion pattern,3 roll formation abrasion, abrasive wear,4 and mechano-chemical abrasion.1,5,6 Since the abrasion mechanism of rubber compounds is an entirely different and complicated, theoretically perfect mechanism for rubber abrasion is hardly reported in the literature. However, the gradual growth of cracks by fatigue and wear by friction have been accepted widely as the main factor in causing failures and wear in rubber composites. A power-law relation has been suggested between the wear rate (Rw) with applied frictional work (Wf) on rubber composites using the specially designed abrasion testers as given below:1,5-8
where k′ is a rate constant and n is power. This equation can only be confirmed, when values of the frictional work can be measured during the frictional abrasion, which is usually not available in commercialized abrasion tests. Hence, attempts are underway for new test types of equipment and methods, which can generate some information on frictional work input. In this regard, it has been made possible to measure the frictional energy using the blade abrader test machine and then suggesting wear behaviors of rubber composites.1,5,6,9,10
The fatigue failure is a result of the cumulative damage caused by repetitive loading on elastomeric compounds for a long time. To get rid off from early fatigue failure and wearing and to improve the overall performance, it is necessary to understand the mechanism of failure in rubber composites. At a microscopic level, the failure mechanism in rubber composites is like a cutting off of elastomeric chains and their networks by a mechanical load and formation of new surfaces. The failures in rubber composites may be either catastrophic or fatigue failure depending on the modes of loading. The catastrophic failure is an instantaneous failure that occurs on high loading, whereas, fatigue failure is a consequence of the periodic and continuous application of low loading on rubber composites. In rubber failures, another power-law relation has been proposed between the crack propagation rate (dc/dn) and tearing energy (G) as below:7,11
where k is a constant and n is power. The cracks initially begin from inherent impurities or microcavities, and the initiated cracks grow at a specific rate on the application of continuous tearing energy.
Several researchers have suggested that a quite good correlation exists between the abrasion rate and the crack propagation for amorphous rubber compounds, although a severe deviation is found for the strain-induced crystallizable rubber-like natural rubber.7,8
As an extension to understand such ambiguities further, we tried to find out an inter-relationship between the performances of SBR rubber composites under fatigue and wear failure on the basis of theoretical assumptions. The exact evaluation of the wear rate of rubber composites is very important from the industrial point of view, especially for the tire manufacturing sector.
Experimental
A solution polymerized styrene-butadiene rubber (SOL-6270SL, polycyclic aromatics (PCA): < 3 wt.%, Kumho Petrochemical Co., Korea) was used in this study. To improve abrasion resistance, the rubber samples were filled with silica (Zeosil-115, Rhodia) and carbon black (N330, Madein, Korea). To control the silica and rubber interactions in silica-filled compounds, a silane coupling agent (Si-69TM, TESPTS, Bis[3-(triethoxysilyl)propyl] tetrasulfide, Sigma Aldrich) was used by 8 wt.% of silica loading.12 Wax and N-isopropyl-N′-phenylenediamine (3CTM, Kumanox) were used as anti-degradants. The N-cyclohexyl-benzothiazole-sulfenamide (CZ) and 1,3-diphenylguanidine (DPG) were used as sulfur crosslinker and accelerator respectively in the composites. The other ingredients were of typical grades as are used in the tire industry. Table 1 shows the recipe for the rubber compounds used in this study. To see the effect of the silane coupling agent, the silica-filled compound by 50 phr was also prepared without any treatment (S50NT).
To prepare rubber composites, the mixing was carried out in a Banbury internal mixer at 130°C with a rotor speed of 60 rpm. The rubber was masticated for about 1 min and the calculated amount of reinforcing fillers (carbon black, silica, and silane coupling agent) along with other ingredients were blended into rubber matrix except curing agents. In the case of silica-filled rubber compounds, the silica and silane coupling agents were first blended and then remaining ingredients were added to prevent any undesirable reaction of other ingredients with coupling agent.13-15 The curing agents were added in filler master-batches using a two-roll mill at around 100°C. Finally, mixed batches were made into a sheet form and kept for 24 hr at room temperature for stabilization. The cure characteristics of rubber composites were measured by cure rheometer (ODR-2000, Alpha Technologies, USA) at 160°C. The curing of rubber specimen was carried out with hot press (Carver, USA) maintained at 160°C for a fixed period by rheometer.
The tensile properties of the samples was measured by using tensile tester (LRX plus, Lloyd Instrument) based on the ASTM D412 standard. Dumbbell shape samples were stretched at a rate of 500 mm/min at room temperature and stress-strain curves were obtained to determine tensile strength, modulus, and elongation at break.
The measurement of tear strength (GC) is carried out to determine the resistance to tear force by rubber samples on the application of extreme external energy. The tear strength was measured by tear tester (LRX) using trouser shape sample (Figure 1) as per ASTM D 624 method. The samples in 95×35×1 mm dimensions were taken and a pre-cut of 30 mm length was made to direct the progression of crack on tearing the samples. The compression molding of the samples was carried out only after attaching cotton cloth on both sides of the samples so that the applied tear force could effectively be used in growing the length of the pre-cut crack of the samples. In case, the crack has followed a non-linear route during the tearing of samples, the crack route was reset-up by using a knife. At the end of the experiment, the shape of the tear forced sample becomes like saw-tooth and tear strength was calculated using equation (3). To determine the tear strength, an average of tear force (F) was calculated using maximum and minimum values of saw-tooth and then dividing by torn thickness (t) as below:
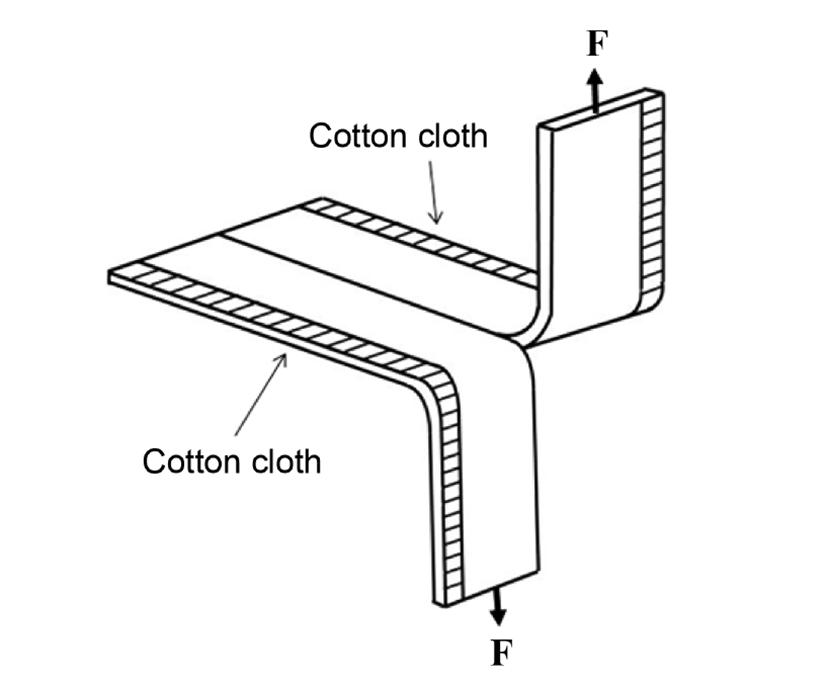
Figure 2 is a schematic representation of the instrument used for the measurement of fatigue failure of the sample. The sample used in measurement was a pure shear specimen having a length to width ratio of more 4 with a dimension of 106×24×1.2 mm capable to fit properly in fatigue instrument. The extent of deformation in the sample was controlled by controlling the reciprocating motion of one side clamp that was responsible to generate tearing energy (G) on the specimen. For specimen without pre-cut, the tearing energy was determined using Griffith relation (Equation 4) as below:11
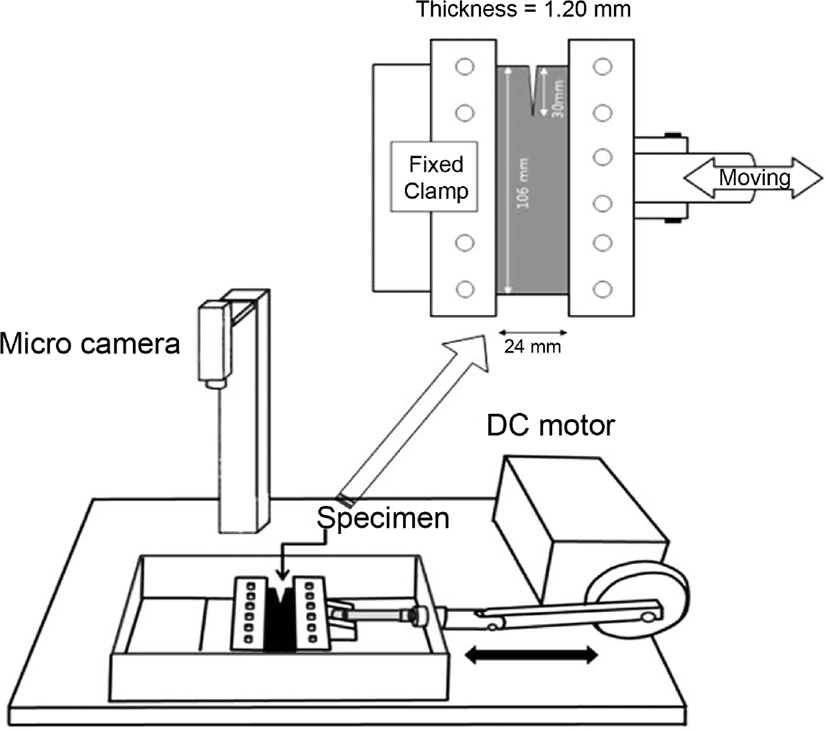
where U is strain energy density, which was taken as the area under the unloading stress-strain curves of a pure shear specimen without pre-cut at a specific strain (Figure 3). h0 is clamping distance in the fatigue crack growth experiment. The crack growth rate is determined from the slope of a plot drawn between the length of propagated crack (c) and number (n) of repeated deformation applied to the specimen. The strain in this study varied between 0.8 to1.0.
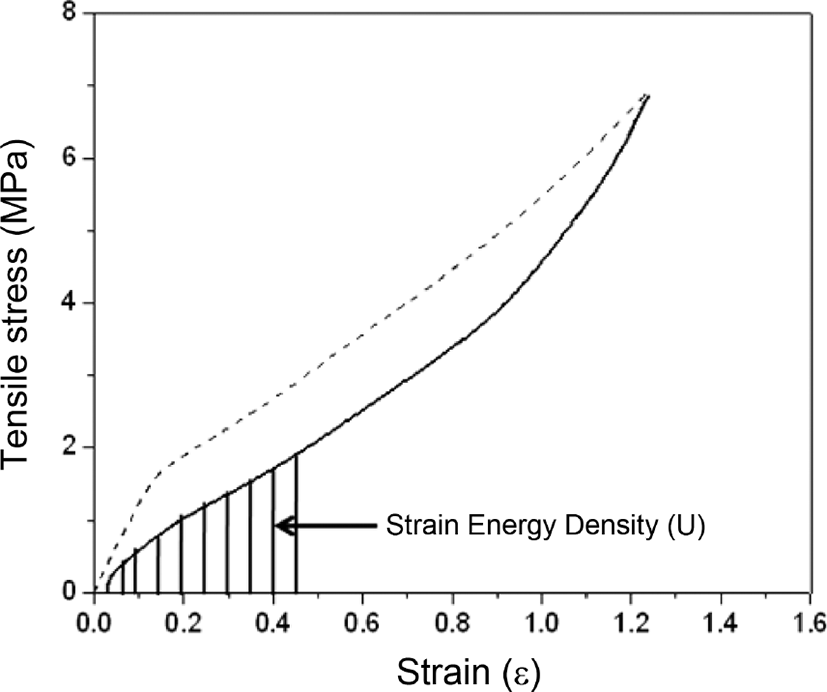
Figure 4 shows a schematic representation of a blade-type abrasion test machine used in the measurement of wear failure property of the specimen. Perpendicular load of different weight was put on to the specimen through the blade and load was controlled by using weights of different masses (1, 2, 3, 4, etc/kg). The frictional torque (M), which was produced at the surface of specimen on its rotation, was measured from strain gauge on blade axis and frictional work (Wf) was calculated using equation (5). The wear rate (WR) by frictional work is defined as loss in weight (g) of specimen while the specimen axis is rotated once (Equation 6). A log-log plot was drawn between frictional work (Wf) and wear rate (WR). Since there was no work done at the center of specimen, hence it was assumed that the wear of specimen at center was negligible. The shape of specimen has helped in its clamping and releasing easily from the holder.
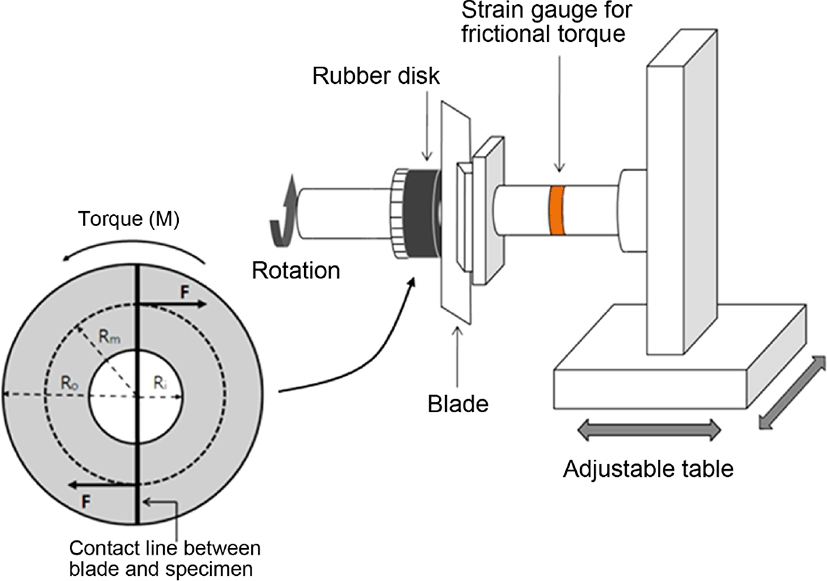
Where M is frictional torque, R0 is an outside radius of specimen (18.6 mm), Ri is a radius of hole in the specimen (5.9 mm).
Where T is loss in weight in ‘g’ on wearing the specimen and ηR is revolution at that time.
Results and Discussion
Table 2 shows the results of tensile properties of SBR rubber composites, which indicated that modulus of rubber composites has increased on increasing the amount of silane coupling agent and silica in rubber composites. Thus to make a similar amount of strain in a rubber composite an additional amount of energy would be required. The modulus of composites containing silane coupling agent and silica together was found to higher than that of the composites, which were containing only silica as a filler. This has been attributed to the added silane coupling agent, which played a significant role in enhancing the chemical interactions between silica and polymer chains of SBR matrix. The carbon black filled composites prepared at the same filler ratio of silica have shown consistently excellent tensile strength. These improvements in the tensile strength of the composites could be explained by considering the presence of a large number of hydroxyl groups in added silane coupling agent, which allowed enhanced chemical interactions between filler and polymers by absorbing a significant amount of crosslinking and co-crosslinking agents at the interface of fillers and polymers in the composites. These studies have suggested that the silica filled composites might be prepared to have physical properties comparable to carbon black filled composites by adding an optimized amount of crosslinking and co-crosslinking agents in the composites.
Results shown in Table 2 have indicated that tear strength (Gc) has shown an increasing trend on increasing the amount of silica and silane coupling agents in rubber composites. However, the tear strength of rubber composites filled with carbon black of the same filler ratio was found to be higher in comparison to rubber composites filled with silica and silane coupling agent, which might be due to better resistance to extreme crack growth in carbon black filled rubber composites.16,17 These results of tensile and tear property of composites have indicated that physical interactions of carbon black with rubbers were able to provide better resistance to extreme deformation by large force in comparison to chemical interactions between silica/silane coupling agent and rubbers in prepared composites.18,19
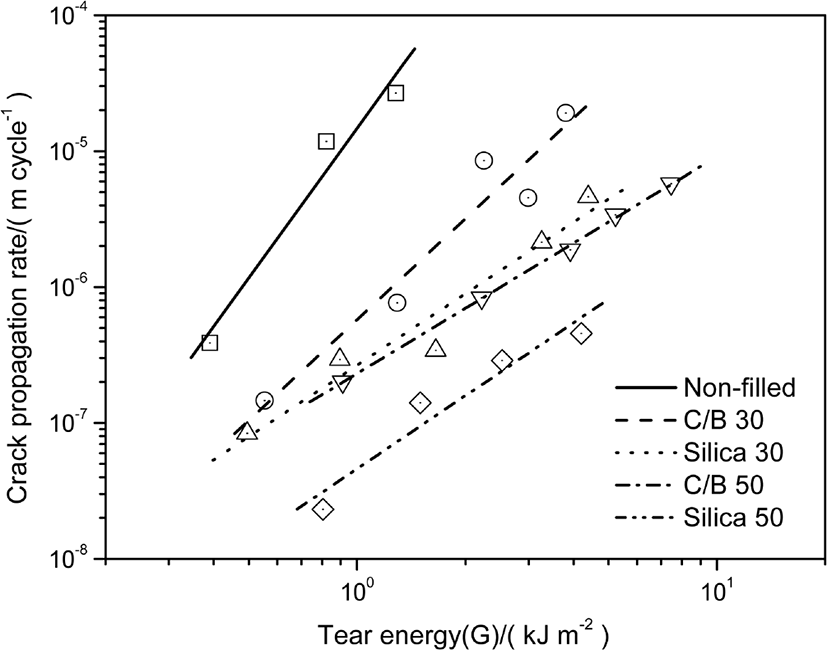
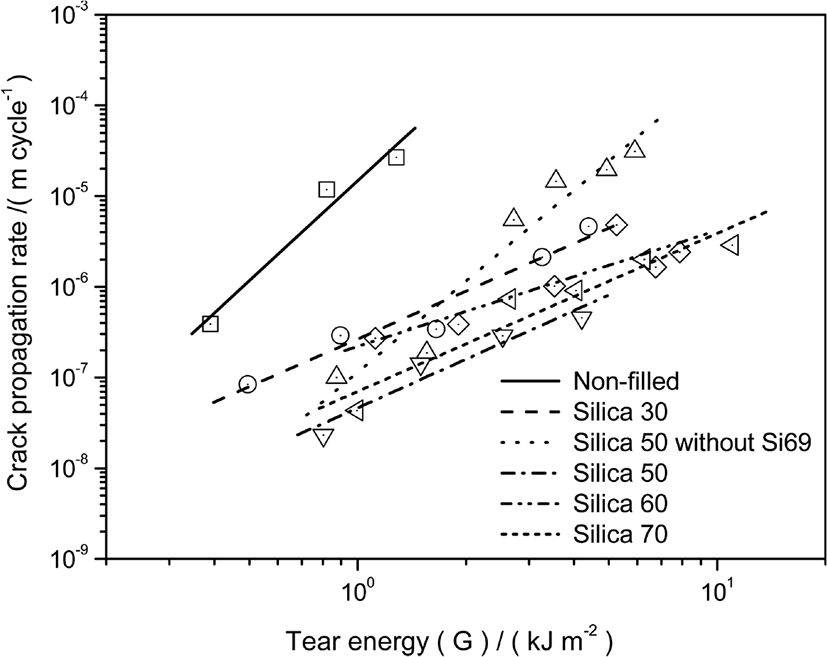
Figures 5 and 6 are log scale plots drawn between crack growth rate (dc/dn) versus tear energy (G) for rubber composites filled with carbon or silica fillers (Figure 5) and on filling rubbers with different amount of silica (Figure 6). The results shown in these figures have shown a linear relation between crack growth rate (dc/dn) and tear energy (G) for rubber composites with a regression coefficient (R) ranging from 0.96~0.98, which confirmed the applicability of the power-law relation (dc/dn = k.Gn) for the variation in crack growth rate (dc/dn) on varying the tear energy (G) in rubber composites. Thus Power-Law equation is able to explain the observed fatigue failure in prepared rubber composites. The failure characteristics after crack growth by fatigue (Figure 5) have indicated that the resistance to fatigue cracks in composites with silica filler/silane coupling agent is found to be better in comparison to composites filled with carbon black. The observed resistance to fatigue cracks in composites with silica filler/silane coupling agent is found to be in contradiction to the results for tensile strength and tear strength. Hence, it can be assumed that the resistance to physical fatigue cracks is superior for the composites with silica/silane coupling agent due to better chemical interactions of filler with rubber matrix. The resistance to fatigue failure was found to be poor in rubber composites filled with silica in comparison to rubber composites with silica/silane coupling agent or carbon black. This was because there was neither a chemical interaction between rubber and silica nor a better dispersion of silica in the rubber matrix as found in carbon-black filled composites.20
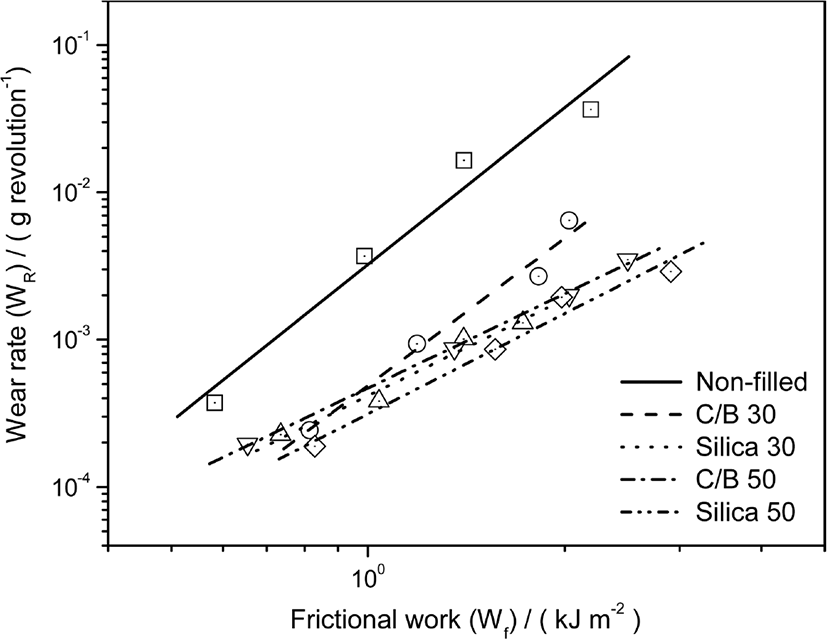
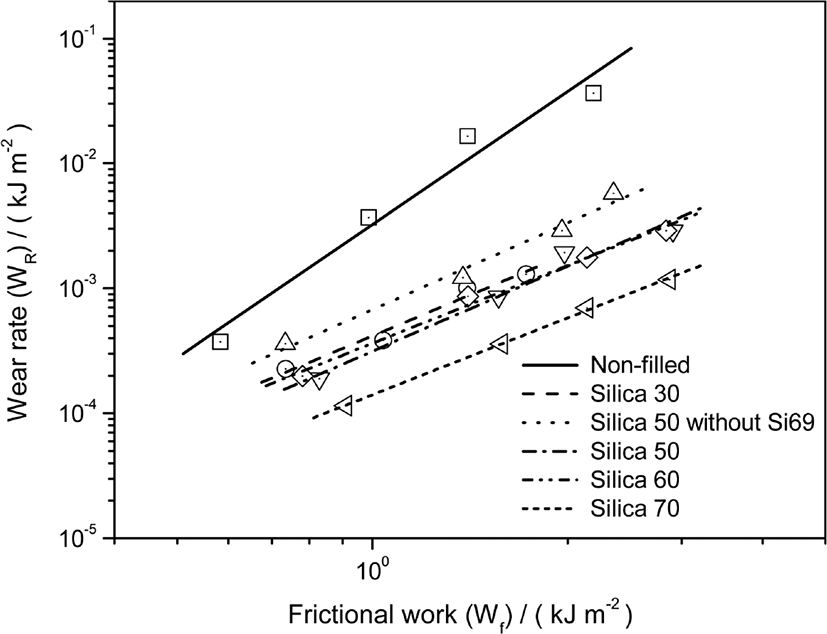
Figures 7 and 8 are log scale plots drawn between wear rate (WR) versus frictional work (Wr) to explains the frictional wear on using blade-type abrasion test machine in rubber composites filled with carbon or silica (Figure 7) and rubbers composites filled with different amount of silica (Figure 8). Similar to that of fatigue test, the results shown in these figures have shown a linear relation between wear rate (WR) and frictional work (Wr) for rubber composites with a regression coef-ficient (R) ranging from 0.98~0.99, which confirmed the applicability of Power-Law equation for the variation in wear rate (WR) on varying the frictional work (Wr) in rubber composites. The results have indicated that the frictional wear resistance has increased on increasing the amount of silica/silane coupling agent and even found to be better in comparison to carbon black filled composite in the same filler/rubber ratio.
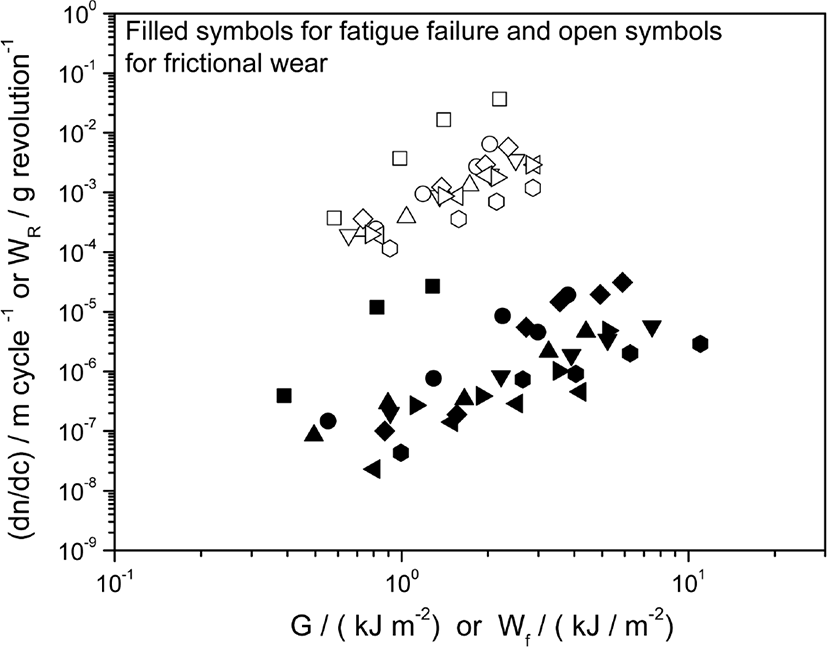
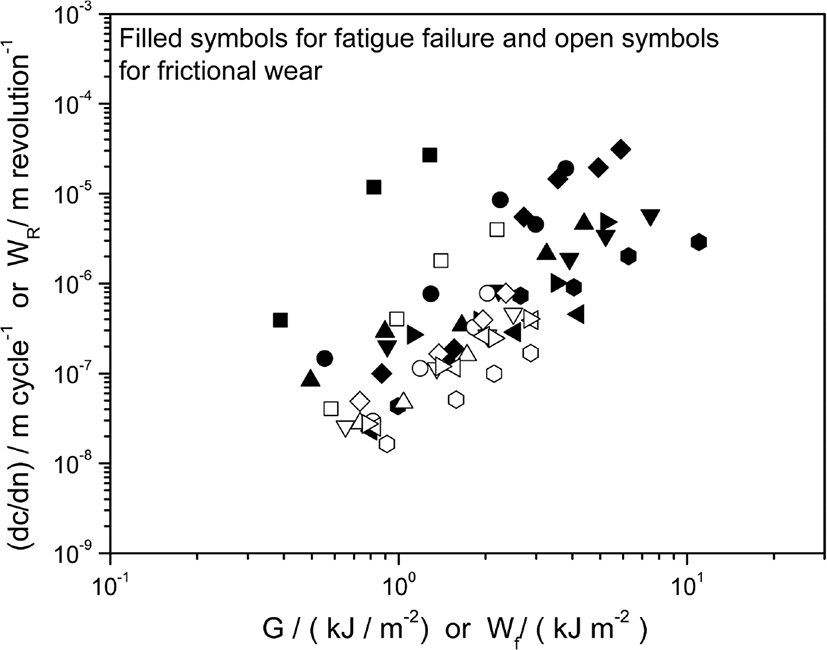
To investigate a relationship between fatigue failure resistance and frictional wear resistance of SBR rubber composites filled with carbon black or silica, a combined plot is drawn (Figure 9) having data for fatigue (dc/dn vs G) and frictional wear (WR vs Wr) in composites (Figure 9). The analysis of the plot (Figure 9) has indicated that the data of fatigue failure were having a similar slope and similar distribution to that of slope and distribution for the data for frictional wear resistance in rubber composites filled with silica and carbon blacks. It is well known that the wear rate is defined as loss in weight (g) by the blade on one rotation of wear specimen. However, in these studies, the wear rate has been calculated using decrease in height (m) of specimen after one rotation of wear specimen in place of loss in weight (g) after one rotation of wear specimen. A combined plot is also drawn (Figure 10) having data for fatigue (dc/dn vs G) and frictional wear (WR vs Wr) in composites (Figure 10) with different amount of silica in rubber matrix. The trends and distribution of data for fatigue failure and frictional wear in composites with different amount of silica were found to be similar; hence these trends can be used to predict mutual dependence of these properties (fatigue failure and frictional wear) of rubber composites filled with carbon blacks or silica.
Conclusion
The present studies on SBR rubber and silica composites have amply supported the theoretical relations between fatigue failure and frictional wear in rubber composites. The fatigue failure and frictional wear test data have shown significant agreement to a power-law relation between rate of wear and frictional work; hence the power-law relationship can be used to define the property of fatigue failure and frictional wear in SBR rubber composite filled with silica or carbon blacks. The combined data for fatigue failure and frictional wear for rubber composites have shown similar trends and distribution, hence they could be used to develop interrelationship for these properties and to prepare a composite with tailor-made properties. These studies have also confirmed that the wear failure in composites has taken place due to crack growth of wear pattern and similar mechanism is also applicable for crack growth failure by fatigue. The tensile and tear properties of rubber composites have shown an increasing trend with the increase in silica content in the matrix. The composites with silane coupling agent were found to be better due to enhanced chemical interactions between silica and rubber matrix. In the absence of silane coupling agent, the miscibility and dispersion of hydrophilic silica filler in SBR matrix were poor; hence these composites without silane coupling agent were of inferior properties and deteriorated quickly. The resistance against crack growth (by mechanical fatigue) and wear (by friction) has shown an increasing trend on increasing the amount of silica/silane coupling agent in rubber composites. The SBR rubber composites filled with silica/silane coupling agent have shown higher fracture-resistance and wear-resistance as compared to carbon black filled composites in similar filler weight ratio. These data have clearly suggested that chemical interactions of silica/silane coupling agent were having higher impact on failure by mechanical fatigue than physical interactions, which were largely present in carbon black filled rubber composites.